
The resounding victories in recent elections by Democrats Zohran Mamdani in New York, Abigail Spanberger in Virginia and Mikie Sherrill in New Jersey has reinvigorated the party after a dismal year since Donald Trump became president.
The victories were not a mandate for a sharp ideological shift to the left. This may be true for Mamdani, but it is not for Spanberger and Sherrill, since both are mainstream centrist Democrats. The main reason for the victories can be seen in the chart below.
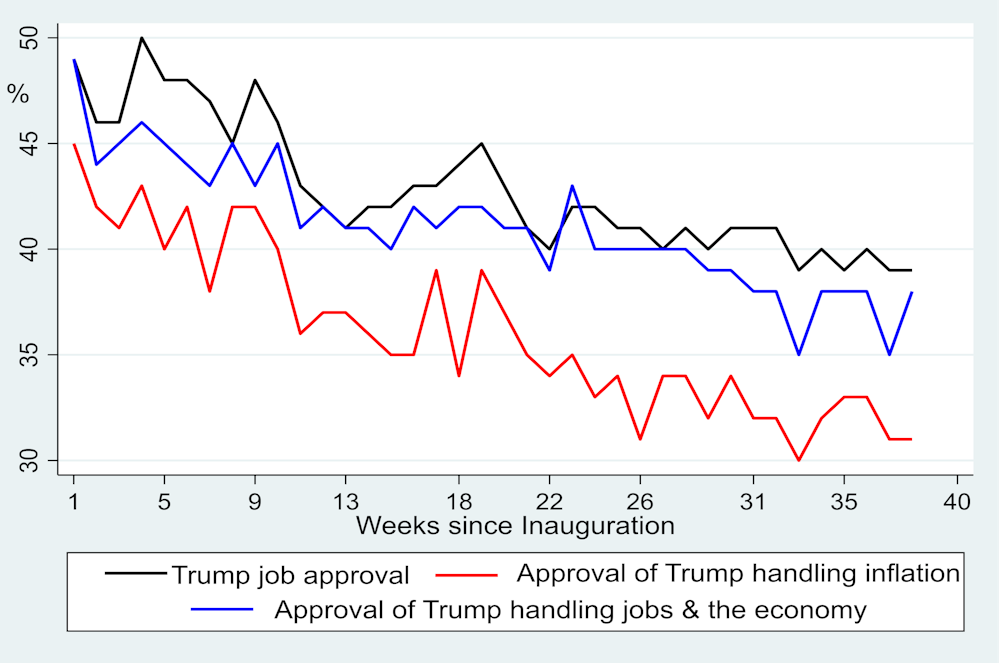
Trends in presidential job approval and Donald Trump’s handling of the economy 2025:
Paul Whiteley/YouGov, Author provided (no reuse)
The data comes from successive polls in the United States conducted by YouGov on behalf of the Economist magazine. All three candidates focused on the issue of the US economy which proved to be a winning strategy since it is clear the economy strongly affects Donald Trump’s job approval ratings.
As the president’s ratings on the economy decline, so does his job approval ratings. The result is that the Republicans took the blame for failing to deal with the issue.
The midterm Congressional elections in the US are due to take place in November 2026. Given the strong relationship between the economy and support for the president, it is interesting to examine how the economy is likely to influence support for the Democrats in those elections.
To investigate this, we can look at elections to the House of Representatives over a long period, given that they occur every two years.
The graph below compares the number of House seats won by the Democrats and economic growth in the US in all 40 House elections since 1946. Economic growth is weighted so that the Democrats benefit from high growth when they control the House but are penalised by this when the Republicans are in control.
This also works in reverse with low growth producing a poor electoral performance for the party when Democrats are in charge and a good performance when the Republicans are in control.
The relationship between economic growth and House seats won by Democrats 1946 to 2024:
Federal Researve Bank of St Louis/Paul Whiteley, Author provided (no reuse)
The impact of the economy on voting in these elections is clearly quite strong, but the number of House seats won declines as the party’s majority gets larger. This is what is known as a “ceiling” effect meaning that when the majority is very large it is difficult to win more seats even in a thriving economy.
But this relationship can nonetheless be used to develop a forecasting model of the seats likely to be captured by the party in midterm elections next year.
When forecasting seats, an additional factor to consider is the inertia of party support over successive elections. If the Democrats did well in one year, they were likely to do well two years later.
For example, in 2008 when Barack Obama won the presidential election, the Democrats captured 233 House seats and the Republicans 202. In the following midterm election in 2010 the party won 257 seats while the Republicans won 178 and so the Democrats retained control of the House.
At the moment the House has a Republican majority of 219 against 213 Democrats. So Republican control is quite vulnerable to a surge in support for the Democrats.
Multiple regression analysis
The forecasting model involves a multiple regression analysis. This uses several variables to predict the behaviour of a specific variable – in this case the number of House seats won by the Democrats.
In addition to the two variables already mentioned, approval ratings and the performance of the economy, the fact that the incumbent president is a Republican is included in the modelling as well since this influences the vote for the Democrats.
We know the number of House seats from the 2024 election and the fact that Trump is a Republican, so to forecast Democrat House seats we need a prediction for economic growth in 2026.
The Federal Reserve Bank of St Louis provides data which forecasts growth in the US economy up to 2028. It predicts that growth in real terms will be 1.8% in 2026 – and when this is included in the modelling, the overall forecast from these variables is 80% accurate.
If a variable is a perfect predictor of House seats it would score 1.0 and if it failed to predict any seats at all it would score 0. The impact of growth on seats when the Democrats controlled the House was 0.75, the inertia effect of past Democrat seats was 0.26 and Trump’s presidency was 0.19.
Low growth boosts Democrats’ prospects
Clearly economic growth dominates the picture showing that low growth rates next year will strengthen the Democrat challenge. This is likely to happen since a recent IMF report suggests that US growth is likely to slow next year.
Actual and predicted House seats in elections 1946 to 2026:
The Presidency Project/Paul Whiteley, Author provided (no reuse)
The third chart shows the relationship between Democratic House seats predicted by the model and the actual number of seats won by the party. The predictions track the actual number of Democrat House seats fairly closely and so the forecast should be reasonably accurate
It should be noted that all forecasting models are subject to significant errors. As the chart shows, the predicted number of seats is not the same as the actual number and if something unforeseen happens the predictions could be wrong. That said, however, the forecast is that the Democrats will win 223 seats – an increase of ten over their performance in 2024. This will give them enough to hand them control of the House.